How to use the CHOOSE function
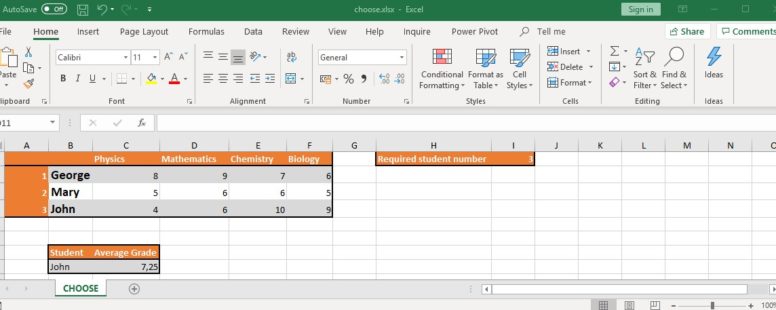
Probably the easiest to understand lookup function is the CHOOSE function. It returns a value from an array of values, that corresponds to a specific position in that array.
Probably the easiest to understand lookup function is the CHOOSE function. It returns a value from an array of values, that corresponds to a specific position in that array.
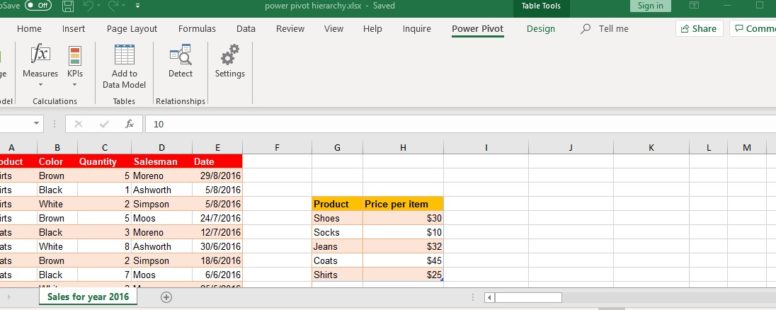
Let us take the next step in power pivot tables. We will talk about hierarchies in Power Pivot and will show a bit more of its functions.
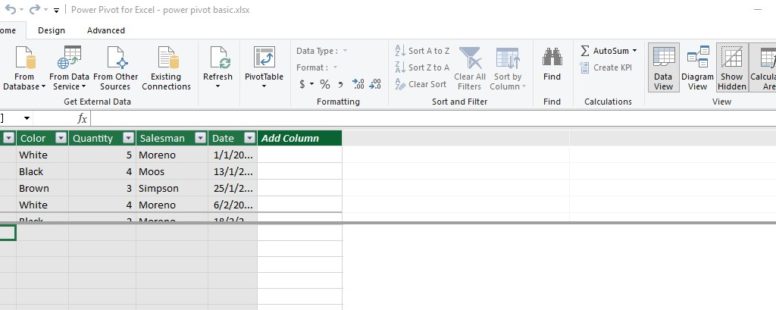
Although Pivot tables are very powerful, in the professional editions of excel there is one optional add-in more powerful and versatile than any other.
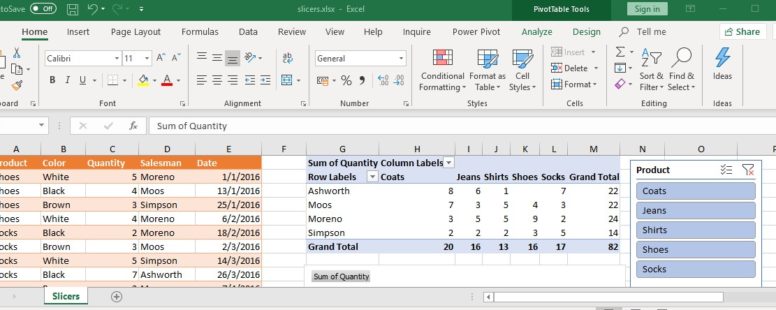
Since Excel 2010, a new and very interesting feature was added. Slicers. At first glance, they might seem like a beautified way to filter a pivot table, but they can be a lot more than that.
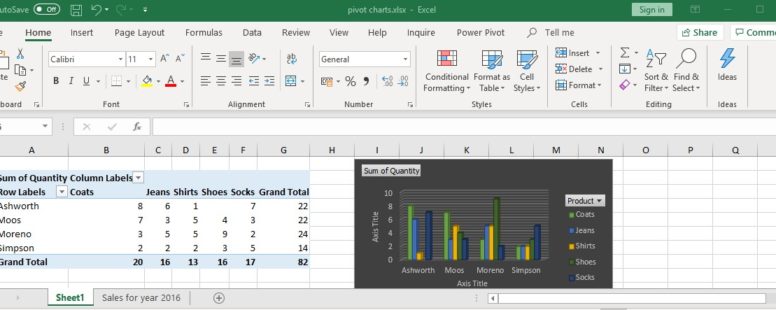
Pivot charts in Excel are the visual representation of pivot tables. They are connected to each other and every change on the table affects the chart and vice versa.
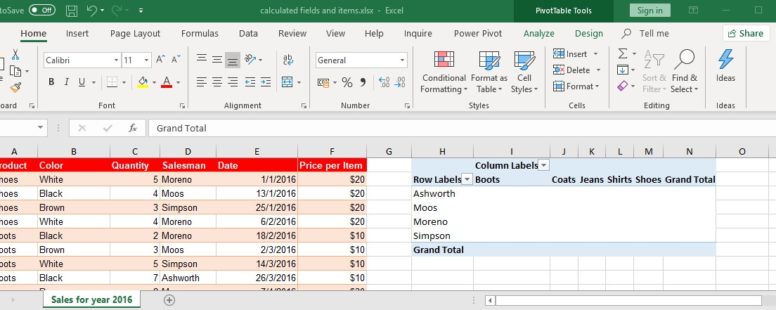
In this lesson we will try to explain and use a very useful feature of pivot tables. The creation of Calculated fields and items.
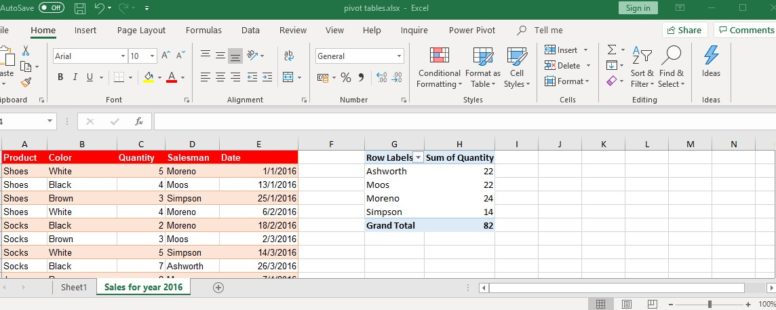
Pivot tables might as well be Excel’s most powerful feature. A pivot table helps you to summarize and analyze your data, thus extracting the significant information from a large and detailed data set.
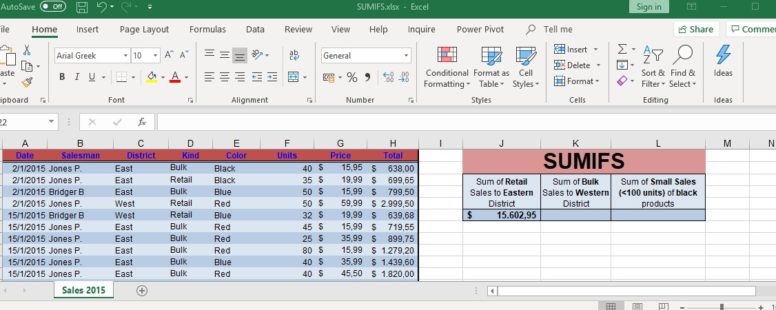
Excel has provided us with several functions to help us make sense of huge pools of data. SUMIFS is one of them.
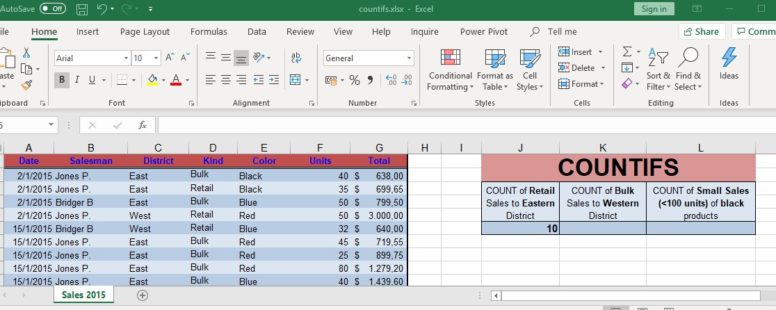
Excel has provided us with several functions to help us make sense of huge pools of data. COUNTIFS is one of them.
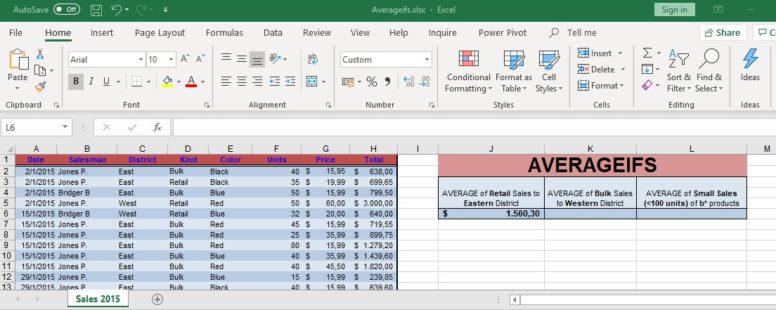
Excel has provided us with several functions, to help us make sense of huge pools of data. AVERAGEIFS is one of them.
