Creating Pivot Charts in Excel
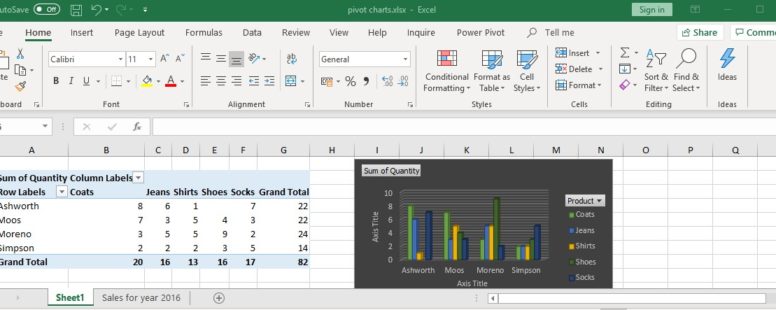
Pivot charts in Excel are the visual representation of pivot tables. They are connected to each other and every change on the table affects the chart and vice versa.
Pivot charts in Excel are the visual representation of pivot tables. They are connected to each other and every change on the table affects the chart and vice versa.