Let us take the next step in power pivot tables. We will talk about hierarchies in Power Pivot and will show a bit more of its functions.
Practice File:
Transcript
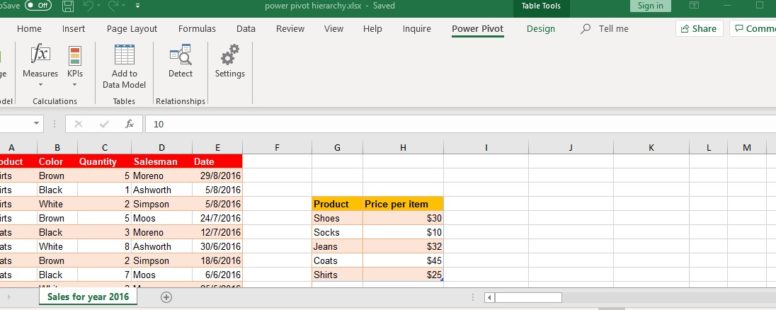
In our current sheet we have two tables already added in the data model. So we click on Manage on Powerpivot tab.
We can see the two tables. We toggle the diagram view, and notice the relationship between them.
Before we talk about hierarchy, let’s click on the design tab and create a date table.
A new table has been created. This is basically a table of all the dates in the year.
We will create a relationship between our date field on the first table and the date field on the new table.
If you notice on the Calendar table, there is a field called date Hierarchy.
The hierarchy field is a collection of columns that we can create as child levels nested under the first in their order.
For example, the hierarchy field will show us the Year and nested under it as child levels of a tree-like form the month and the date column.
Let’s create a hierarchy of our own in the second table. We right click on the Product field and select create Hierarchy.
We will use the name “Product and Price”.
We need to add the price per item field in it. We can either right click on the field and add it to the hierarchy, or we can simply drag it and drop it in the required order.
If we right click on a hierarchy field, we have a number of choices. We can move it up or down, which can be accomplished with drag and drop as well.
We can also rename it, which we will do on the DateColumn field, and will set it to “date of sale”.
We will hide the original column name from all hierarchy fields, to avoid mixing them up with other similarly named fields in our model.
Now it’s time to see how these all affect our pivot tables. We create a new pivot table on a new sheet to have more room.
We set the date hierarchy as column, and Products and price as row. The sum of quantity is what we need to see.
We can see that in the column section only one column exists. The year 2016. This is the first field in the date hierarchy. By clicking on the plus sign we can see that a lot more columns appeared showing the months that at least one sale took place. This is the second field of our hierarchy.
So if we click on the plus sign of February we expect to see the third field (date of sale) appear under it.
It is very convenient to have a flexible way to review our data. In this example we can see the dates of sale from February only without having to see all the columns of all the dates of sales. Something like this could make our data unreadable.
In the rows hierarchy field, the nested field provides us with just some extra information about the parent field which is the price in this example.
Reviewing our table, we decide that the date of sale field is useless for our current analysis. So we go back to powerpivot and Remove it. We save our changes and review the new pivot table.
We notice that since the sales are all for one year we really do not need the year subtotal. We right click on it and disable it.
This is the final layout of our pivot table.
