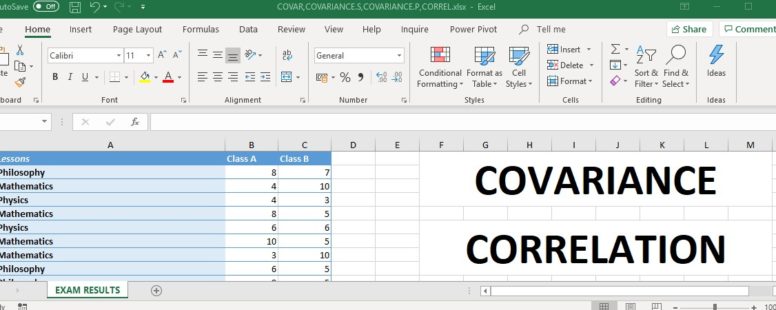
In statistics, covariance and correlation are measures of how much two random variables change together. A positive number would indicate a positive linear relationship between the variables and a negative number would indicate the opposite.
Practice File:
Transcript
A common simple example to better understand covariance and correlation is that with the balloon.
As a balloon is inflated it gets larger and all its dimensions get larger respectively. The height, the width, and the depth of the balloon increase. This means that in sets of two these dimensions have a positive linear relationship.
When we have finished filling the balloon with air we seal its open end. While sealed we squash the balloon in one dimension, let’s assume the width.
We notice that while the width is decreased the other two dimensions increase to manage the extra volume of air. This means that, when we squash a balloon, the width and the length or the depth variables have a negative linear relationship, while the length and depth have a positive linear relationship since they both increase.
Correlation in addition to telling us whether variables are positively or negatively related, also tells us the degree to which the variable tend to move together. Its value can be from -1 to 1.
Excel provides us with three functions to calculate covariance and one for correlation.
The COVAR function which is still present in Excel 2016 for compatibility reasons. It has been replaced by COVARIANCE.P and we should avoid using it since its support could seize in future versions of Excel.
The COVARIANCE.P which is used when the supplied data are the whole population, and
the COVARIANCE.S which is used when our data consist only a sample of the entire population.
To calculate Correlation, we only need the CORREL function.
So now that we have a general idea of what covariance and correlation mean and what functions to use, we can go on and put our knowledge to a test.
In this sheet we can see all the exam results of a student for the current year.
In cell B8 we will calculate the covariance between Physics and Mathematics assuming that our data consist the entire population.
First we type the function COVARIANCE.P, since we use the whole population for physics and mathematics and then the two cell ranges that reflect our data.
We have a positive result which means that physics and Mathematics have a positive linear relationship. When one result is better, chances are that the second one will be better too.
Then let’s assume we only had the data displayed with yellow background, which are only a sample of the entire population, and we need to calculate the covariance between Physics and History in cell B9.
We will use the COVARIANCE.S function. As before we will provide the two cell ranges in question.
The result is a negative one which means that as the exam results of Physics (and Mathematics as we have seen before) are getting better the exams in History are getting a lot worst.
For your information: If we calculate the covariance between two identical sets, for example Physics and Physics, the result will be the same as the Variance of the dataset Physics.
To compute the correlation coefficient between Physics and Mathematics in cell B15 we use the Correl function, providing the two relevant cell ranges.
Using the same function, we calculate the correlation between Physics and History. We notice that the correlation between Physics and History is negative and between Physics and Mathematics positive as with covariance.
There is a lot of Math behind covariance and correlation, which surpass the objective of this lesson. Luckily there are a lot of online resources on the subject for anyone who wants to dive in the hard stuff.
