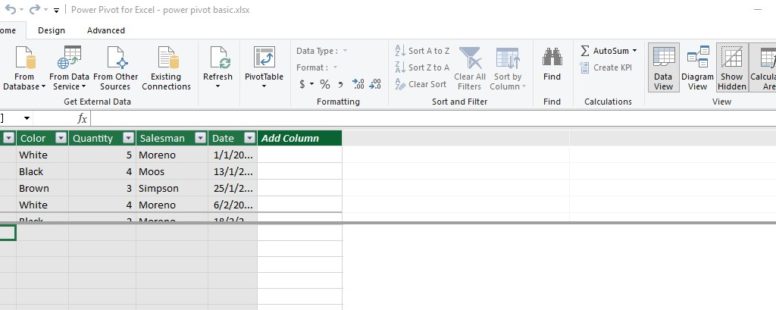
Using the PowerPivot add-in with Excel
Although Pivot tables are very powerful, in the professional editions of excel there is one optional add-in more powerful and versatile than any other.
Although Pivot tables are very powerful, in the professional editions of excel there is one optional add-in more powerful and versatile than any other.
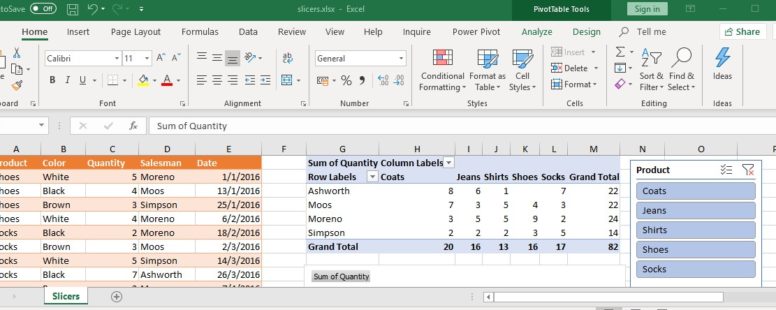
Since Excel 2010, a new and very interesting feature was added. Slicers. At first glance, they might seem like a beautified way to filter a pivot table, but they can be a lot more than that.
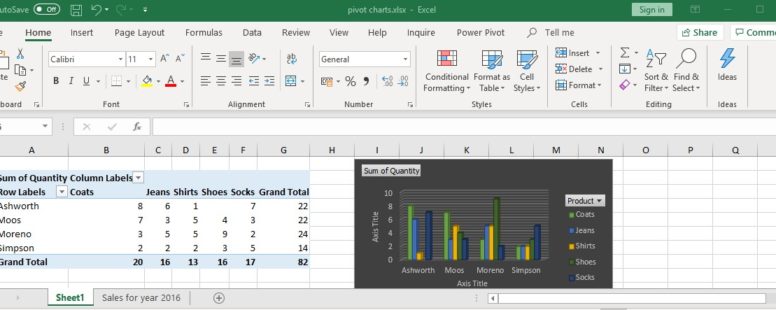
Pivot charts in Excel are the visual representation of pivot tables. They are connected to each other and every change on the table affects the chart and vice versa.
In this lesson we will try to explain and use a very useful feature of pivot tables. The creation of Calculated fields and items.
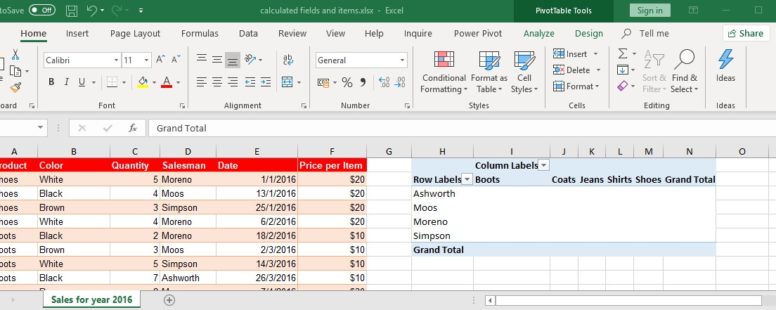
Pivot tables might as well be Excel’s most powerful feature. A pivot table helps you to summarize and analyze your data, thus extracting the significant information from a large and detailed data set.
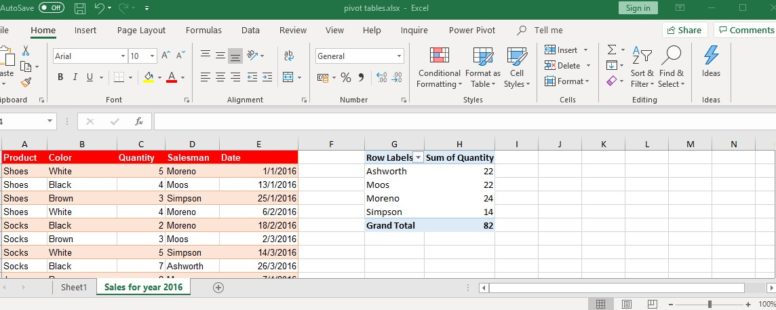
Excel has provided us with several functions to help us make sense of huge pools of data. SUMIFS is one of them.
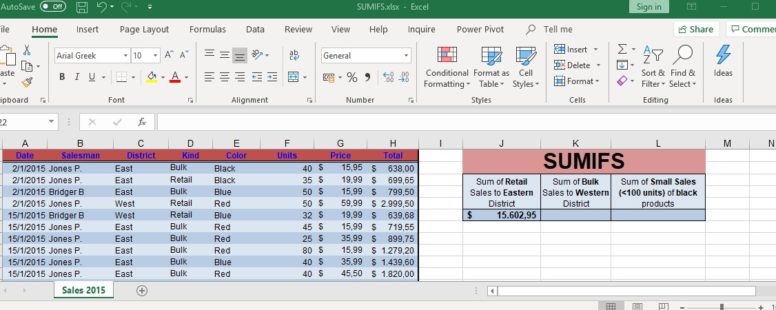
Excel has provided us with several functions to help us make sense of huge pools of data. COUNTIFS is one of them.
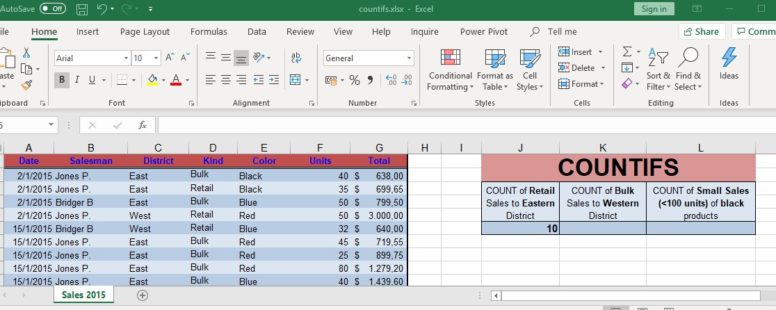
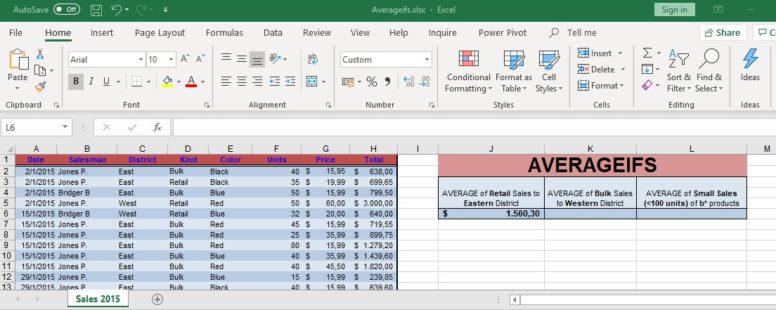
Excel has provided us with several functions, to help us make sense of huge pools of data. AVERAGEIFS is one of them.
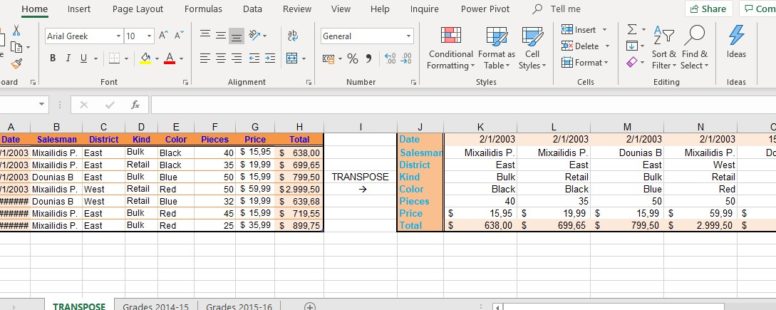
It is certain that at some point everybody needs to alter the form and layout of their data, in order for them to be more readable, or answer to some specific visual requirements.
The ability to transpose our data is such a need.
In another tutorial we saw how we can find ourselves a better loan for a new car, using Goal Seek . Although Excel’s Goal Seek is a powerful tool, it has one basic limitation. It allows only one variable to be changed to help us achieve our goal.
Excel provides an even more powerful tool that bypasses this limitation. The Solver. The Solver is in the form of an add-in which must be enabled before you can use it.
