When you are working in statistics Excel can be a very powerful ally.
In statistics there are various ways to measure the average – or more appropriate, the central tendency – of a range of numbers.
Excel implements three of them.
Practice File:
Transcript
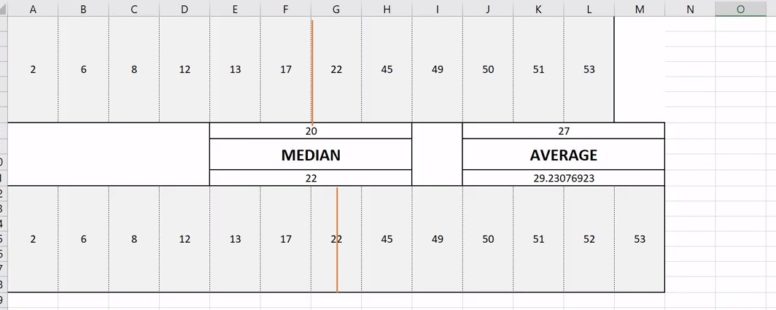
First is the arithmetic mean measure of central tendency, which is the sum of all the numbers in the data set divided by their count. This is the most commonly used in all the areas of life and science and not just statistics. In Excel it is represented by the well-known function AVERAGE.
Next is the Median measure of central tendency which calculates the value that separates the higher half from the lower half of the data set. For an odd set of numbers, the median is the number in the middle of a sorted set. For an even set of numbers it is the average of the two numbers in the middle. The Excel function is called MEDIAN as well.
Lastly is the MODE function (replaced by the MODE.SNGL and
MODE.MULT functions) which implements the Mode measure of central tendency.
It calculates the most frequent value in the data set. This makes it the only measure that can be used with non-numeric data. Not in Excel though. Excel requires all three functions to use numeric values.
Let’s see these in practice. We want to calculate the central tendency using all three measures for the data set in the cell range B3 to M6.
In cell B9 we calculate the mean average. We use the average function followed by the cell range and we have our result.
Using the function MEDIAN in cell B10 we have the second measure.
Lastly in cell B11 we use the mode function to acquire the last measure of central tendency.
Notice the difference between the first two with the last measure of tendency. If the values are not symmetrically distributed these variations in the results are common.
